Coding agents keep running your Mac out of memory. What to check first
Use memory pressure and process ownership to diagnose RAM exhaustion, reduce concurrency, or move the agents' browsers and test workers into cloud sandboxes.
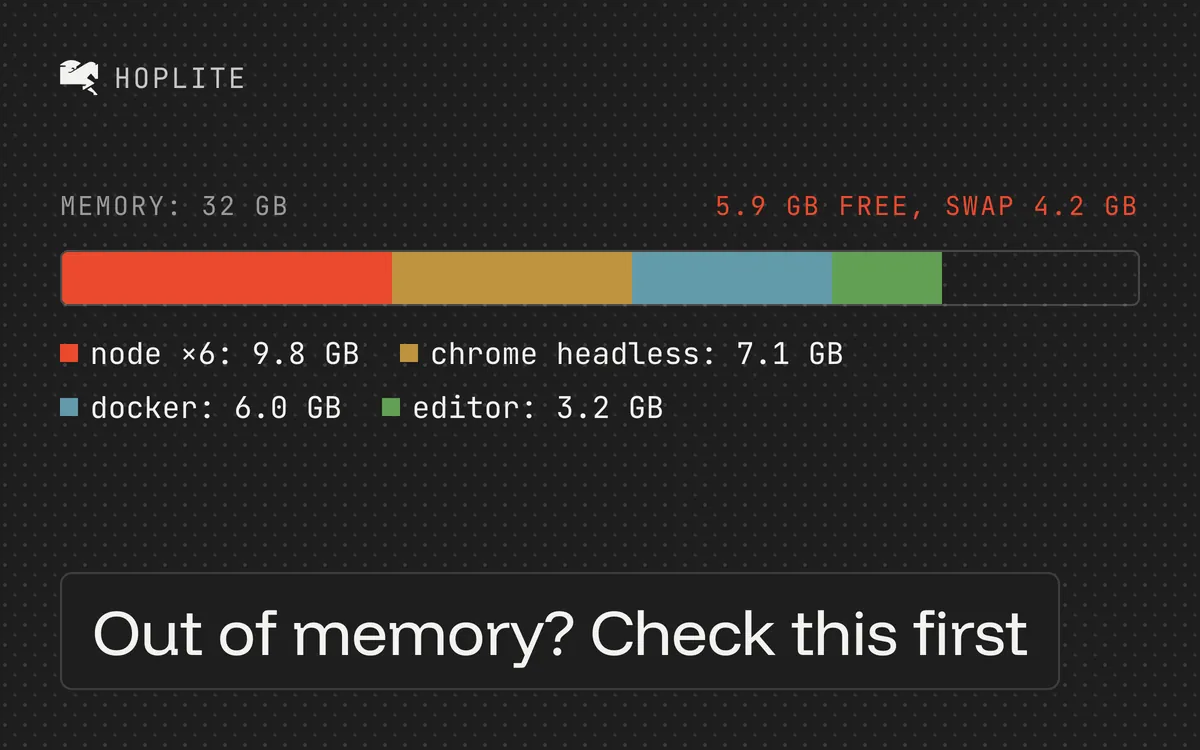
You have several coding-agent sessions open, a browser full of previews, and a test suite running. Then macOS asks you to close applications because it has run out of memory.
The agent's terminal is only part of that workload. Each task can bring a browser, language server, test workers, and a local service with it. Before assuming you need a different laptop, identify which processes are using the memory and whether they still belong to active work.
Check memory pressure first
In Activity Monitor, open Memory and inspect the largest processes. Look at the memory-pressure graph as well as individual totals. Apple's memory guide explains that macOS also uses compression, cached files, and disk-backed swap. A large amount of used memory alone does not tell you whether the system is struggling.
Observe the trend while you repeat a known task. Does pressure rise as additional agents start their tools? Does it ease when you stop a test run? Keep that sequence with your notes. It is more informative than one screenshot taken after everything has become unresponsive.
Find the processes the agents started
Match busy processes to commands in the task history. Two sessions can both invoke the same runtime, so the process name may not identify the owner. Check the process details, command, and working directory where available before stopping anything.
Look for duplicate dev servers, browser instances left open after verification, and test runners using more workers than the machine can comfortably support. If a tool offers a documented concurrency setting, try a smaller value and rerun the same workload. Avoid raising a runtime's heap limit while the whole machine is already under memory pressure.
Save unfinished work, then close unused processes through their normal controls. If you must force-quit an unresponsive process, expect unsaved state in that process to be lost. A broad command that kills every Node process can also stop the application you were trying to preserve.
Full memory or a leak
A workload that fits with one task and struggles with several may be a concurrency problem. A process whose memory keeps growing after useful work has stopped warrants a separate investigation. That observation is a reason to investigate a leak, not proof of one.
For Claude Code, the official troubleshooting guide recommends measures including restarting between major tasks and testing with customizations disabled. Preserve the task's useful state before changing the session.
Be careful with diagnostic files. The same guide warns that a heap snapshot can contain conversation text and credentials. Use the documented reporting path and inspect what you share instead of attaching raw process memory to a public issue.
Limit concurrency
Pick a representative task and measure it alone. Add another only after the first workload is stable. Include the editor and services you normally keep open so the result resembles your actual day.
There is no universal number of agents that a given amount of RAM can support. A documentation edit and a browser-heavy test run have different requirements. You may be able to keep several lightweight tasks active while scheduling expensive checks one at a time.
Or take the memory off your machine
No concurrency setting makes four browsers, four test runners, and an editor fit in 16 GB. If you want to stop tuning that, use a cloud coding agent like Hoplite.
Each Hoplite run gets its own sandbox. The dev server, test workers, language server, and the browser the agent uses to verify its work allocate memory there. Your Mac holds the editor and a browser tab. Memory pressure on your machine stops tracking how many agents you have running.
Cloud memory is finite too. A leaking process exhausts a sandbox the way it exhausts a laptop, and too many workers inside one run still fail. The difference is that it fails in the sandbox and not in your editor.
Start by moving one build-and-test task. Confirm it runs correctly there, stop the duplicate local services, and check memory pressure again.